Bull Market Drawdowns
During that 11 month run, bitcoin experienced 8 drawdowns of 20% or more, including one immediately upon breaking the previous ATH as we are experiencing now:

You can read the full report from here
Bitcoin Drawdowns During Bull Markets
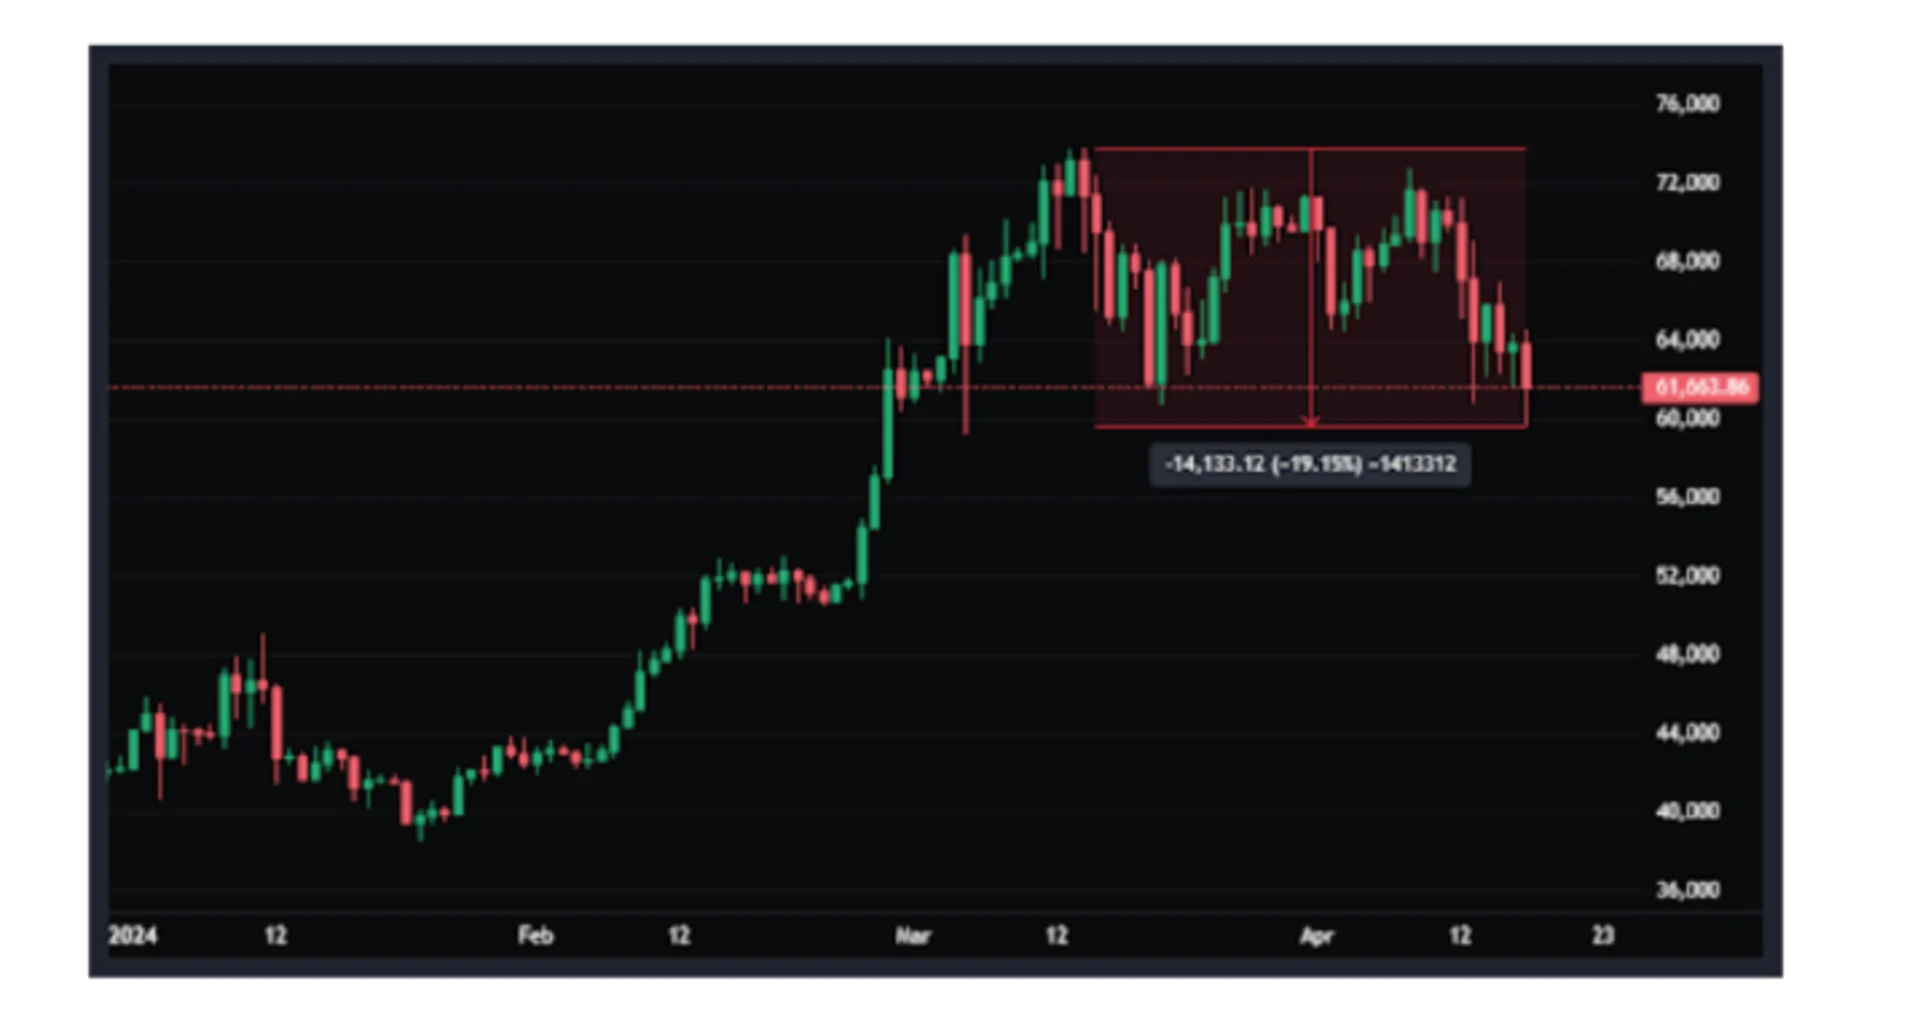
After setting a new all-time high of $73,836 on March 13th, bitcoin recently fell as low as $59,648 for a peak-to-trough drawdown of 19.2%.

We take a look back at the last two bitcoin bull markets to see how common a 20%+ correction has been on the path from a break of previous all-time highs to the setting of new all-time highs.
In January 2017, bitcoin broke through its previous all-time high of $1,134 on its way to setting a new all-time high in December, 2017 of $19,892.
During that 11 month run, bitcoin experienced 8 drawdowns of 20% or more, including one immediately upon breaking the previous ATH as we are experiencing now:
In December, 2020, bitcoin broke through its previous all-time high of $19,892 on its way to setting a new all-time high in November, 2021 of $69,000.
During that 11 month run, bitcoin experienced 4 drawdowns of 20% or more.
So, as history shows us, 20%+ bull market drawdowns are not uncommon.
Bitcoin's recent fall from fresh all-time highs has been accompanied by the same in stocks as the US 10 year yield has surged 72 bps year-to-date to 4.67%. Meanwhile, despite the rise in bond yields, gold and other commodities continue to hover around all-time highs as inflation expectations have increased.
This suggests that, in the short-term, bitcoin remains more correlated with financial liquidity conditions and long-duration risk assets, rather than traditional inflation.
You can read the full report from here